There’s a growing awareness amongst digital users that every byte of data that’s uploaded or downloaded has an environmental impact. Part of this impact comes in the form of CO2 and other greenhouse gas emissions. These emissions arise because the hardware and infrastructure involved in storing and transferring data from A to B requires electricity to run, and that electricity has to come from somewhere. In 2021, over 61% of the world’s electricity was generated through burning fossil fuels (source: Electricity Mix by Our World in Data), the dirtiest form of electricity.
These emissions arising from using digital tech are often abstract and out of sight. But developers have the power to make them more visible through surfacing, visualising, and presenting emissions data in ways that make it easier for people to comprehend and act on.
The task of calculating these emissions is far from simple. Due to the complexity of the infrastructure and devices involved in data transfer, and the difference between the electricity mix in different geographical locations, we have to make generalisations and assumptions along the way.
This is where CO2.js comes in.
We’ve brought together best-in-class, peer reviewed carbon estimation models and packaged them up into a versatile, open-source JavaScript library. Developers using CO2.js spend less time implementing these models into working code, repeating unnecessary work. Instead, they’re able to spend more time actually using the models to build reliable, robust carbon measurements into their software, sites, and apps.
In this guide, we’ll show you how to quickly get started generating digital carbon estimates with CO2.js.
Common use cases for CO2
CO2.js helps developers:
- Estimate the carbon emissions produced by transferring bytes of data on the internet;
- Get different forms of grid intensity data, such as annual average and marginal data by country;
- Checking if a website is hosted on a known green web host.
Installing CO2.js in your project
In this guide, we’ll assume you have a Node JS project. You can use NPM to install CO2.js into an existing project.
npm install @tgwf/co2TypeScript support
Type definitions for CO2.js are published in the DefinitelyTyped project, and are available on NPM at @types/tgwf__co2.
If you want to use type definitions in your project, they should be installed as a devDependency.
npm install --dev @types/tgwf__co2
Other installation options
To use CO2.js in the browser, or other environments, check out the other installation options available in the CO2.js docs.
Estimate carbon emissions of data transfer
The main use case for CO2.js is to take a number of bytes and return an estimate of the CO2 produced from transfer them over the internet. This could use useful for lots of things such as estimating the CO2 emissions of sending files, loading images or even the emissions from viewing a whole web page.
// Import the library
import { co2 } from '@tgwf/co2'

// Initiate a new co2 object using the Sustainable Web Design (SWD) model.
const swd = new co2({ model: "swd" })

// Use the perByte method to calculate emissions for 1 GB
const emissions = swd.perByte(1000000000)
You can follow our Getting started: NodeJS tutorial for more details.
Carbon estimation models and methods
CO2.js includes two, peer reviewed carbon estimation models – the OneByte model, and the Sustainable Web Design model. With each model, you need to select a carbon estimation method to use.
In the example above, we have used the Sustainable Web Design (SWD) model with the perByte method to calculate the carbon emissions for 1 GB of data transfer.
Learn more about models and methods
- Find out more about using the OneByte and Sustainable Web Design models.
- Learn more about the CO2 estimation methods available in each model.
Using grid intensity data
The annual average global carbon intensity of electricity is commonly used to produce a wide variety of CO2 estimates, not just ones relating to digital emissions. As carbon intensity can vary greatly from country to country, in some circumstances it can be better to use country-level data instead.
There are lots of ways you can use this data and combine it with other measurements you have. For example, you could use the carbon intensity data for your country to calculate the carbon emissions of an entire office. Alternatively, in the same office you might use it to make decisions about what workloads to run on an in-premise server and when.
Sourcing reliable carbon intensity data shouldn’t be the remit of developers.
The CO2.js API empowers developers to easily access this country-level data for integration into their own calculations. You can choose between country-level average or marginal grid intensity data. This has been available since v0.11.0.
Learn more about grid intensity data
If you want to know the differences between average or marginal grid intensity data, the team over at Electricity Maps have two great blog posts explaining both concepts and why you might use one over the other.
- What is average & marginal intensity?
- Get data in JSON format from the CO2.js GitHub repository.
Get average grid intensity data
You can use CO2.js to import average grid intensity data into your project, and find the average annual emissions for a country.
All countries are represented by their respective Alpha-3 ISO country code.
// Import the average grid intensity data object
import { averageIntensity } from '@tgwf/co2';

// Get the data values
const { data } = averageIntensity;

// Find the average annual grid intensity for Australia
const { AUS } = data;
Get marginal grid intensity data
Likewise, you can use CO2.js to import marginal grid intensity data into your project, and find the marginal annual emissions for a country.
// Import the marginal grid intensity data object
import { marginalIntensity } from '@tgwf/co2';

// Get the data values
const { data } = marginalIntensity;

// Find the marginal annual grid intensity for Australia
const { AUS } = data;
Using grid intensity data in digital carbon estimation models
To surface carbon emission estimates for transferring data in a specific country, you can combine the grid intensity data for that country with a data transfer emissions model.
To do that, you’ll need to modify our source code yourself and then build the library yourself.
We’re working on making this possible through our API and will release this in a future version of CO2.js.
Checking a site is hosted green
CO2.js comes with a handy function which lets you check if a website domain is served from a verified green hosting provider. Under the hood, this function checks a site against our Green Domains dataset and returns a result.
import { hosting } = from "@tgwf/co2";

hosting.check("google.com").then((result) => {
  console.log(result);
});
The code above shows how to check if a single domain is served from a green web host. You can also use CO2.js to check multiple domains at once. Our Check a domain for green hosting tutorial has more information on how to use CO2.js to check for green web hosting.
Case studies
Here’s a few stories of how companies and individuals in are using CO2.js in real world applications today. If you’re using CO2.js in production we’d love to hear how! Drop us a line.

Estimating website emissions in the italian context – Sitigreen & CO2.js
In this case study, we explore how the Sitigreen website carbon calculator uses CO2.js to perform website carbon calculations that are specific to Italian users.

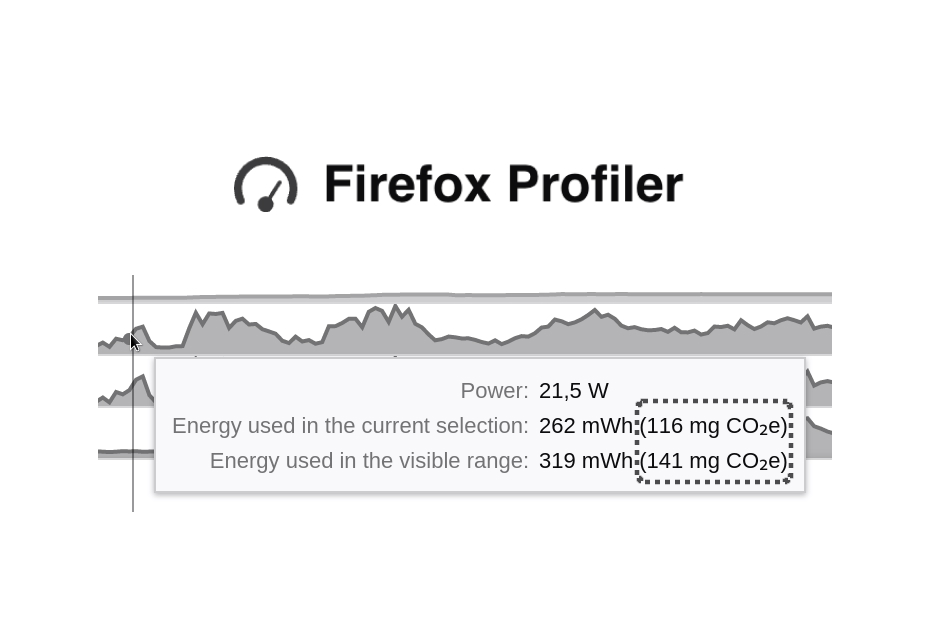
Carbon Emissions in Browser DevTools – Firefox Profiler and CO2.js
In 2023, the Mozilla introduced carbon emissions estimates into its developer tooling. This case study explores how the Mozilla team and Green Web Foundation members made this possible using CO2.js.

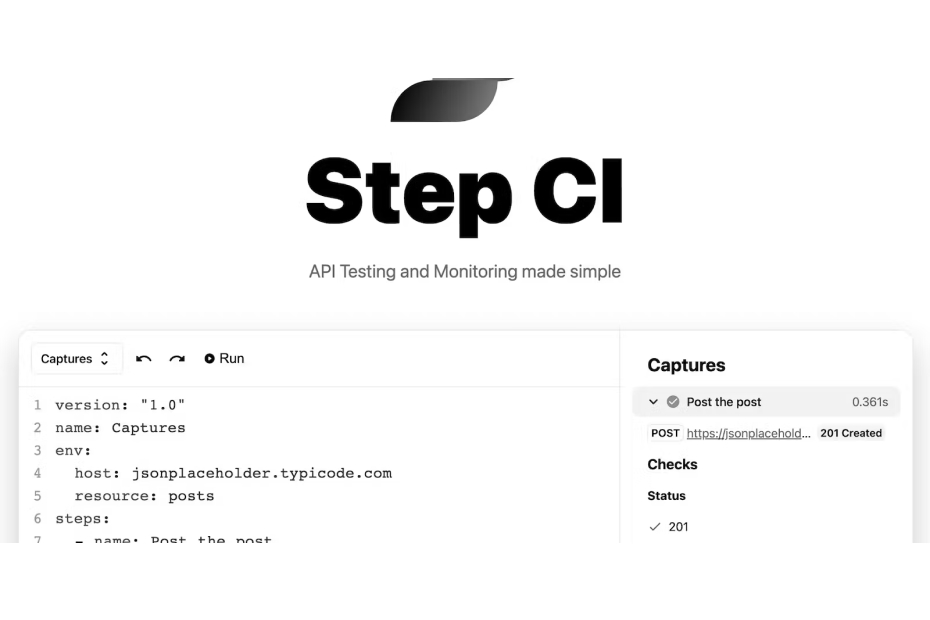
CO2.js Case Study – Step CI
Step CI is a testing and monitoring tool for APIs. In this case study, we look at how they introduced carbon emissions estimates using CO2.js.
Go forth and build
CO2.js allows developers to quickly start calculating digital carbon emissions. It is covered by an Apache 2.0 license, allowing for the library to be used in digital tools and services. Code is kept on GitHub, and we welcome community contributions. There’s also our CO2.js developer documentation for a deeper dive into how it works.
If you’ve made something using CO2.js, we’d love to know! Show us your handy work on Twitter (@greenwebfound), LinkedIn, or by using our website.


