Over this summer we worked with the nice folks at Scott Logic to test drive their new Tech Carbon Standard framework for helping organisations make sense of the environmental impact of their digital estate. We’ve contributed a case study to their open source website, detailing our experiences and workings, and in this post we share the key insights for others curious about using it.
What is the Tech Carbon Standard and why did we try it out?
If you want to get an idea of the environmental impact of the digital services you are responsible for, it can be a bit of a daunting process. Where do you start? And if you’re in an organisation that’s already trying to work out it’s organisational carbon footprint, where does digital fit in?
Earlier this year in February at Open UK, Scott Logic announced their Tech Carbon Standard, a framework they proposed to help people trying to understand footprint of the digital services used within their organisation.
We’ve linked to a video of Oliver Cronk presenting it below:

We’re a non-profit organisation centred around reaching a fossil free internet, and well… if you want to decarbonise the digital services you’re using, it helps to know how much you need to decarbonise. If the Tech Carbon Standard is a helpful tool for that journey then all the better.
Over the summer, Scott Logic allocated some of their staff’s time to work with us to test drive the framework, and share our experiences along the way.
For brevity, we refer to the Tech Carbon Standard as the TCS, a few times in this post.
What can we share?
There is now a detailed case study on the Tech Carbon Standard website of our experiences using the framework to estimate the carbon footprint of our own digital services. In it we detail our assumptions, methodologies and data sources.
It weighs in at just under 20,000 words, there was a lot to say! It includes a shorter insights section of the key things we wanted to draw attention to.
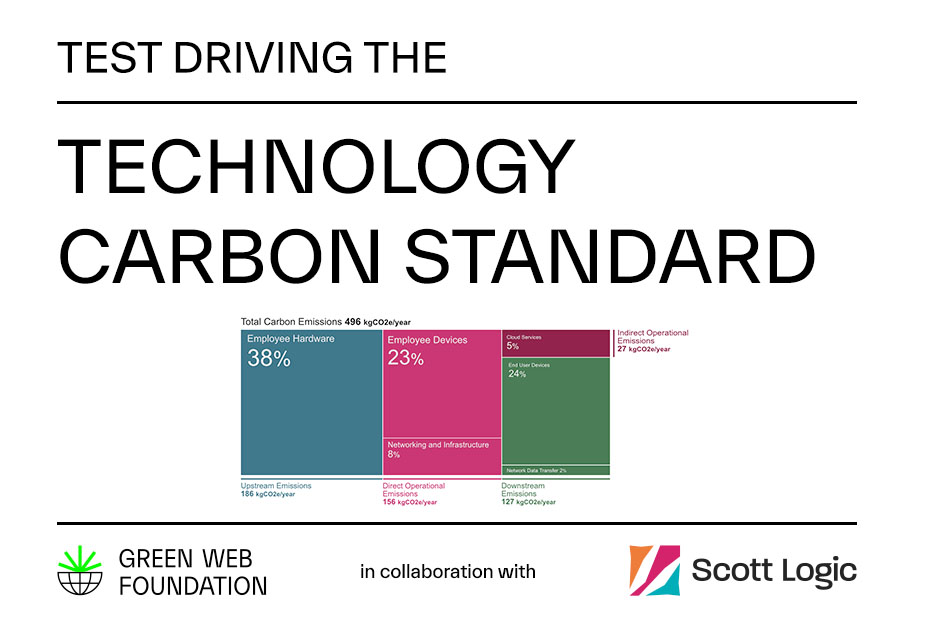
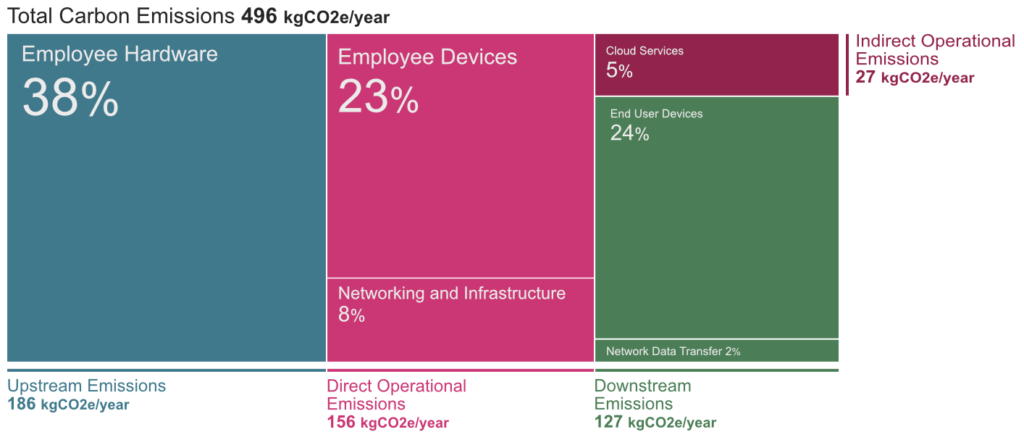
You can also see a nifty graphical treemap below showing how the footprint of our services is allocated across our ‘digital estate’.
Here’s an abridged summary of the 6 insights from our case study below, and in each case our heading links to the more detailed version of the particular insights on the TCS website.
1. Digital technology is not impact free and reductions are possible
Using the TCS, we put our own 2023 digital estate emissions at at least 496 kgCO2e – around half a tonne of carbon dioxide equivalent. We’re a six person team operating a lean non-profit organisation, with a relatively straightforward set of digital products, but this doesn’t include our organisational footprint.
2. TCS helps fill key gaps in estimating digital estate emissions
When we looked at carbon accounting solutions for small businesses, (thanks Icebreaker One!), we saw that the methodologies revolved around using financial spend as the key metric. Faced with no data, starting with spend data can be better than nothing, but they have all kinds of problems too.
Therefore we saw that openly test driving the TCS approach in collaboration with the Scott Logic team was a concrete way to address:
- the relative lack of detailed guidance on estimating an entire digital estate.
- approaches for how to move beyond spend as a metric (when open-source data supports that).
The TCS helps in this respect, and the grouping of emissions broadly along the same lines as the GHG Protocol with scoped emissions is helpful. It does not try to be entirely compatible with the framework, so you might not be able to drop it into a ‘digital services’ section of an existing greenhouse gas emissions inventory if you are creating one for your organisation. But it is helpful for getting the data together.
3. TCS can’t cover everything needed to produce estimates for digital products or services
The TCS is not exhaustive nor tries to be, and it gives a good idea of what the system boundary (i.e. what is left out) is when you work through the framework. Our organisation, and our staff rely on office space that uses lighting and heating to work (we’re not quite ready to write code in the dark all the time…), but these are outside the boundary.
For a full picture we’d want to include these, and other activities like the travel we rely on for occasional in person collaboration. That relies on work we have planned later in the year, to get a fuller picture.
4. The digital sustainability industry needs to look beyond green coding to influencing impactful structural change
One of the reasons people may be interested in digital sustainability and green code is that it can let them express how they feel about the climate crisis, in the way they build digital services. This is totally valid, and it can definitely help, as in many cases building more efficient services can save cash as well as reduce carbon emissions (as well as being fun!). In our case (and we expect others too) the biggest impacts come from sources other than just our code though.
Green code can be helpful for identifying fellow travellers on a decarbonisation journey, but it’s largely a starting point for decarbonising digital services.
5. There’s a serious lack of data and transparency from suppliers
Finding publicly available emissions estimates data for common software is incredibly challenging. In two areas, OTS and Open Source Software and SaaS, we didn’t manage to find any kind of public data for a single supplier to base an estimate on. This means we’ve got gaps in our understanding for the following: Django, WordPress, Zoom, Chrome, Firefox, GitHub, NPM, Google workspaces (GDrive and Calendars), Trello, Zulip, Miro, Brevo, Sentry, 1Password, 34SP (WordPress hosting and emails).
To be clear, we’re not trying to throw shade at these suppliers. We know this stuff is an emerging practice, and it’s hard.
In a perfect world, suppliers of digital services would provide machine readable, publicly verifiable emission estimate data about their operations as whole, and guidance on to allocate it based on their use. Methodologies and assumptions would be completely transparent, not treated as trade secrets. Customers wouldn’t have to make a special request for this data based on their usage. It would be as easy to find as billing data.
In the full case study we point to a few promising projects that might help improve this state of affairs.
6. Employee hardware is more significant than originally assumed, especially monitors
Everyone working on the project expected employee hardware emissions to be large, if only because we’ve invested a significant amount effort over the years in running fairly lean services.
That said, none of us expected it to turn out to be more than two thirds of the overall amount though. Another surprise was what the numbers showed us about the impact of monitors. Again, if you’d asked the project team at the start which represented more emissions – laptops or monitors – we’d have all guessed laptops; perhaps because of their relative costs.
Surprisingly the data we found shows monitors are estimated to produce more emissions on a unit by unit basis. This is true both for the embodied and usage emissions.
This raises an important question. What can we really do to minimize the impact of our employee devices beyond buying differently and using them mindfully? We accept that we do need a certain level of equipment to ensure our team are safe and productive. Once you’ve taken the obvious actions what’s left?
This is what we mean by structural or policy change being needed – for us to go much lower, we’d likely need interventions beyond the scope of what most small organisations might have the resources to take on themselves.
Where to learn more
Our case study is on the TCS website, and is published under a Creative Commons Attribution Non-Commercial Share-Alike license.
If you’re interested in using it yourself there is some further guidance in the Github issues about what constitutes commercial use, but it’s best to contact Scott Logic directly.
If you have further questions about our experiences, or working on something similar, the best way to get in touch is drop us a line via our contact form.